Donoreo
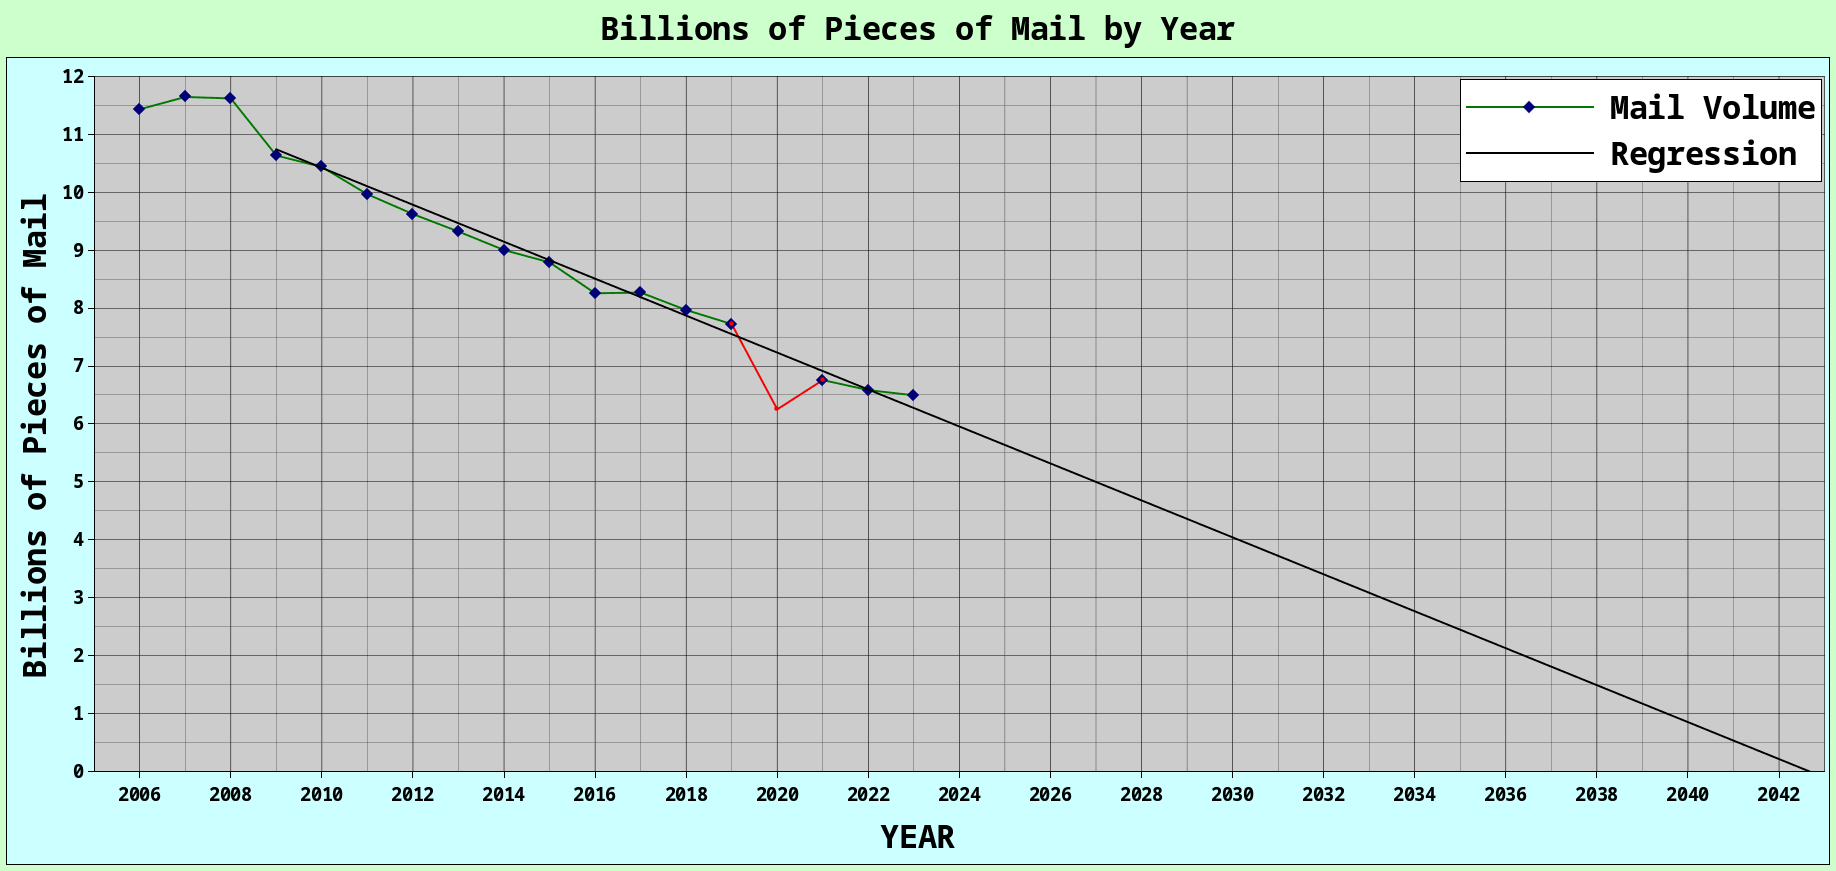
I've found another source for the same data at https://www.ctvnews.ca/canada/article/a-look-at-how-much-mail-canada-post-delivers-amid-a-strike-notice/ This one goes from 2006 to 2023. When you hover over a data point, the numbers pop up. I plotted them. It's not a pretty picture. I did a linear regression from 2009 onwards, skipping 2020. The regression hits zero in mid-2042. If I include 2020, the zero point comes one year earlier.
Things are so bad that the federal government had to "loan" over a billion $CDN ($720 million USD) to Canada Post for curent obligations https://www.marketwatch.com/story/canada-to-provide-c-1-03-billion-to-canada-post-to-avoid-insolvency-at-mail-service-update-fc82ac98 This is for stuff like "keeping the lights on" (literally), water bills, phone bills, meeting payroll etc, etc.
Below is the source data and the resulting graph. You can copy+paste the data into a .CSV file, import into a spreadsheet, and do you own analysis...
Year,"Mail Volume"
2006,11.433
2007,11.646
2008,11.62
2009,10.634
2010,10.437
2011,9.965
2012,9.623
2013,9.321
2014,9.002
2015,8.789
2016,8.256
2017,8.269
2018,7.967
2019,7.724
2020,,6.252
2021,6.757
2022,6.584
2023,6.494