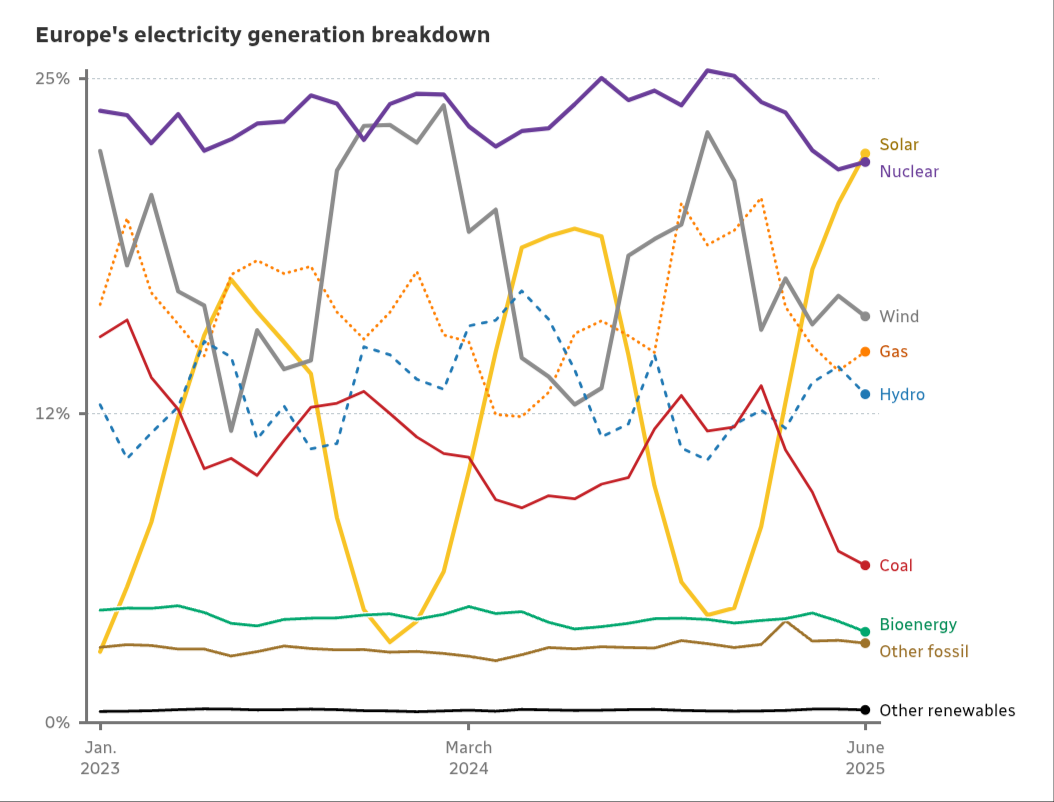
This appears to be an anomaly. Looking at the individual energy contributions from all sources (chart below from article), solar has been very sinusoidal, and only managed to barely eak out a tiny advantage at one of it’s latest peaks. One will note that wind did the same at the end of 2023 / beginning of 2024, it being very variable and spiky itself.
To be meaningful, one must take the long term average of individual contributions. Nuclear clealy has a superior long term average, being much more stable over time. The solar profile has a much lower overall average, repeatedly sinking down to low single digits, once you average that sine wave.
Wind and solar are highly susceptible to seasonal variations, as the chart shows.